If you run and maintain an Open Source project you’ll typically will want to keep track of things like your downloads, stars, commits over time, etc. to help you gauge engagement and overall health of your project. Here’s a quick way hack to keep track of some of this data in Google Sheet which will help you simplify the collection of data and help you better understand what that data means for your project.
GitHub
Let’s start with GitHub repository statistics. To collect data a lot of data from github, you’ll need to generate a token. But, if you’re only going to run a few requests you can ignore the token use, but it is recommended to avoid throttling.
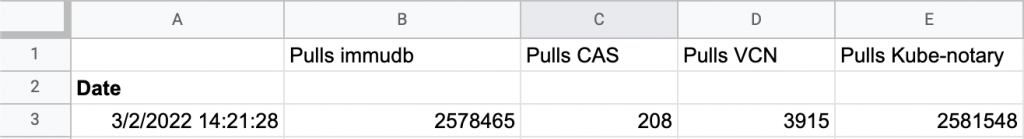
Let’s take our repositories for immudb and CAS. We’d like to collect a monthly entry for the 2 repositories, that look like this:

To start with, let’s first create a Google Sheet with the structure as shown in the above screenshot. We’ll fill the document line by line using Google Apps Script, a javascript platform that lets you integrate with and automate tasks across Google Docs.
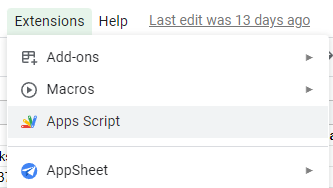
Once we have our documents, we can now click on the “Apps Scripts” entry in the “Extensions” menu:
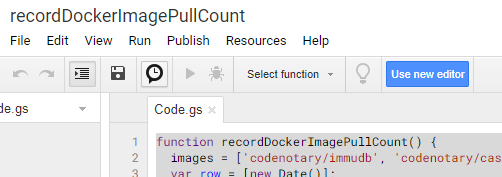
The following script will pull the data from GitHub and populate our sheet. Copy & paste the code into the Apps Script function and give it a name. You only need to change the token to your own and include your repository names.
var TOKEN = 'your-private-token';

function recordGithubstats() {
  repos = ['org/repo', 'org/repo'];

  var headers = {
       "Authorization": "Token " + TOKEN,
       "Accept": "application/vnd.github.v3+json"
   };

   //Logger.log(headers);

   var options = {
       "headers": headers,
       "method" : "GET",
       "muteHttpExceptions": true
   };


  var row = [new Date()];

  repos.forEach(function (repo) {
    var response = UrlFetchApp.fetch("https://api.github.com/repos/" + repo, options);
    var response2 = UrlFetchApp.fetch("https://api.github.com/repos/" + repo + "/contributors?page=1&per_page=1000", options);
    var response3 = UrlFetchApp.fetch("https://api.github.com/repos/" + repo + "/releases", options);
    var downloadStats = 0;
    var repoStats = JSON.parse(response.getContentText());
    var contrStats = JSON.parse(response2.getContentText());
    var downloads = JSON.parse(response3.getContentText());

    Logger.log(downloads);

    for(var i = 0; i < downloads.length; i++) {
      var assets = downloads[i].assets
      for(var x = 0; x < assets.length; x++) {
             downloadStats = downloadStats + downloads[i].assets[x].download_count;
         }
    }


    row.push(repoStats['stargazers_count']);
    row.push(repoStats['forks_count']);
    row.push(repoStats['subscribers_count']);
    row.push(contrStats.length);
    row.push(downloadStats);

  });

  var sheet = SpreadsheetApp.getActiveSheet();
  sheet.appendRow(row);
}
You can now run it to see if the cells in the sheet will be filled with the correct numbers. (Btw, you have quite decent debugging capabilities in Google’s Apps Script to check the API response content.)
That’s it, you now can run it manually or using the built-in scheduler. Our results looked like this:

Docker
We can do the same for Docker Hub too and collect image download statistics. Let’s add the Title to some new columns in the sheet, open the Apps Script editor and paste the following code (just don’t forget to change the image names).

function recordDockerImagePullCount() {
  images = ['org/container', 'org/container'];
  var row = [new Date()];

  images.forEach(function (image) {
    var pull_count = get_image_pull_count(image);
    row.push(pull_count);
  });

  var sheet = SpreadsheetApp.getActiveSheet();
  sheet.appendRow(row);
}

function get_image_pull_count(image) {
  var response = UrlFetchApp.fetch("https://hub.docker.com/v2/repositories/" + image);
  var imageStats = JSON.parse(response.getContentText());
  return imageStats['pull_count'];
}
And here we see our results:
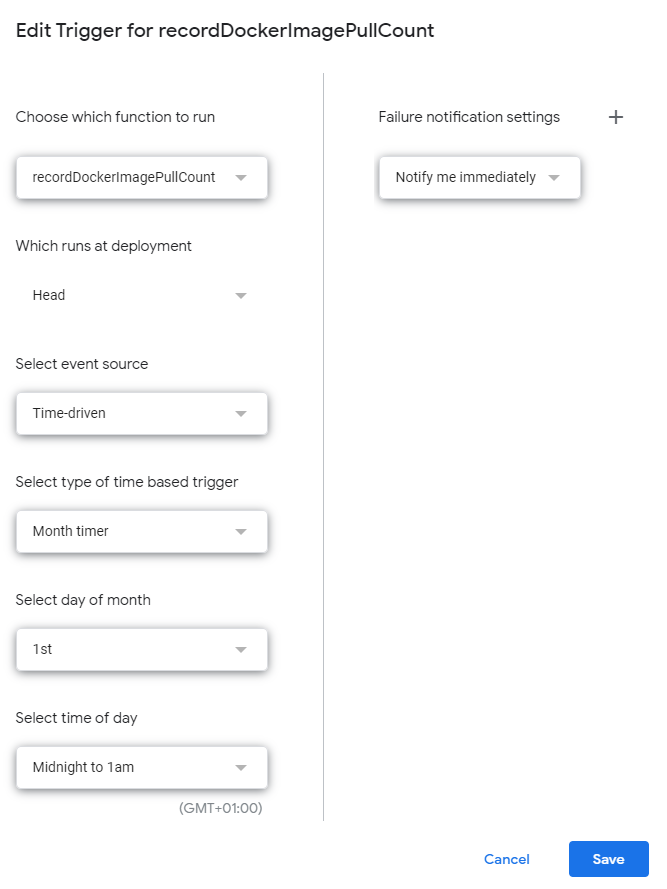
The best thing about using Google Sheets with the Apps script is the built-in scheduler. That way you can run the script daily, weekly or monthly to track all the required statistics.
To do so, just click on the timer icon:
and configure the scheduler
Of course, you can use this kind of script with anything that provides an online API. It’s a very simple, yet very powerful and convenient solution for regular statistic tracking and reporting. Hopefully having more insight into your community can help you better engage with them and continue to grow your contributor base and project.