Introduction
Most modern communications over computer networks are reliant on TLS to keep them safe and secure from unauthorized third parties. It is vital to keep track of the expiration dates of the TLS certificates in use. A commonly used software in professional environments for event monitoring and alerting, for example in case your TLS certificate is about to expire, is Prometheus.
Now imagine that we have Prometheus installed in a Kubernetes cluster and want to be alerted if or when the TLS certificate that we use for reaching the application(s) running on the cluster are about to expire.
This in and of itself should not pose a significant issue. But what if the certificates are not installed within the cluster, but are instead configured on a load balancer that is external to the cluster itself?
We can’t just add a ServiceMonitor for something that is not inside the cluster, can we? Well, there is actually a way to do that. Let’s see it in detail:
Telegraf
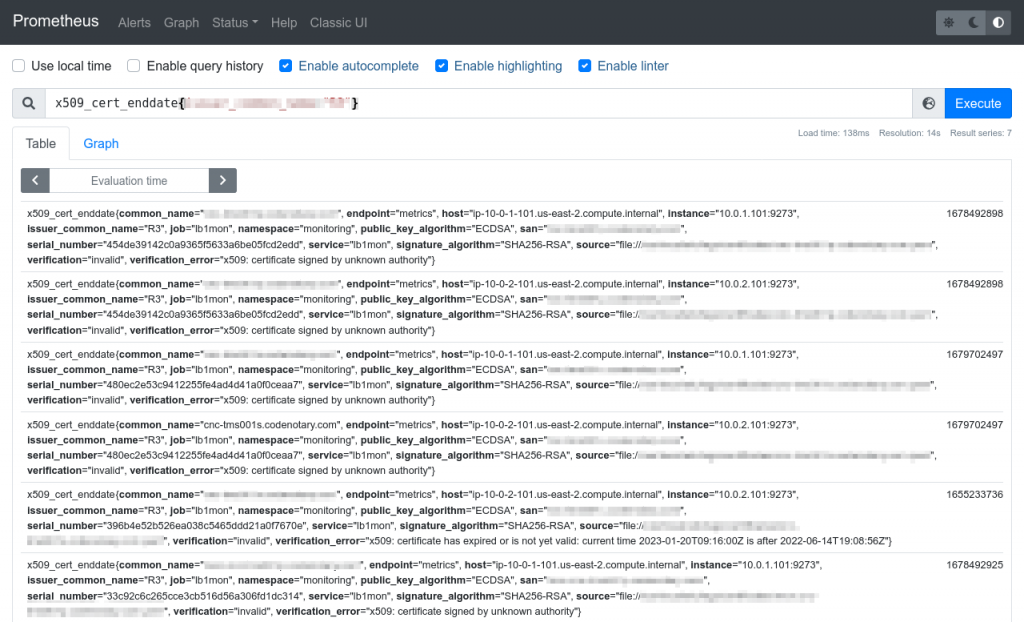
First, we install Telegraf on the load balancer and we export the certificate status using the x509_cert input.
That input can check for a pem file, or a certificate from an URL. We opted to just check every .pem file in the /etc/ssl/private directory, but you can tune the behavior to your needs: see the README for more information.
While we’re at it, we can instruct it to also monitor disk and cpu usage, so that we can actually monitor the whole load balancer performance with Prometheus.
Here is a configuration example:
[agent]
  interval = "60s"
  round_interval = true
  metric_batch_size = 1000
  metric_buffer_limit = 10000
  collection_jitter = "0s"
  flush_interval = "10s"
  flush_jitter = "0s"
  precision = "0s"
  hostname = "blabla"
  omit_hostname = false
[[outputs.prometheus_client]]
  listen = ":9273"
[[inputs.cpu]]
  percpu = true
  totalcpu = true
  collect_cpu_time = false
  report_active = false
  core_tags = false
[[inputs.disk]]
  ignore_fs = ["tmpfs", "devtmpfs", "devfs", "iso9660", "overlay", "aufs", "squashfs"]
[[inputs.x509_cert]]
  sources = ["/etc/ssl/private/*.pem"]
If you are using a load balancing software (we use the excellent traefik for that role) that can “talk” to Telegraf, you can also collect that information and expose it to Prometheus: in that way, scraping a single endpoint will fetch the information for the node itself, the certificate status and the load balancing software metrics.
Endpoint
Usually, Kubernetes knows information about entities (like pods, services, and so on) that are configured within the cluster.
In order to let Kubernetes know that you have an external entity to handle, we have to configure an external endpoint. So we are going to create one for our load balancer, so that Kubernetes knows it exists.
apiVersion: v1
kind: Endpoints
metadata:
  labels:
    k8s-app: lbmon
  name: lbmon
  namespace: monitoring
subsets:
- addresses:
  - ip: 10.0.1.101
  ports:
  - name: metrics
    port: 9273
    protocol: TCP
We will use the namespace monitoring for it, which is the same one we used for our Prometheus instance. That is not mandatory, but it makes sense from a logical point of view. Please take note of the name and label you used, we’ll need that later.
Service
Now that we have the endpoint, we configure a service for it. This will allow up to create a ServiceMonitor for it in the next steps:
apiVersion: v1
kind: Service
metadata:
  name: lbmon
  namespace: monitoring
  labels:
    k8s-app: lbmon
spec:
  type: ExternalName
  externalName: 10.0.1.101
  clusterIP: ""
  ports:
  - name: metrics
    port: 9273
    protocol: TCP
    targetPort: 9273
Note: the name of the service must match the name of the endpoint, or it won’t work. Also, note how we explicitly specify an empty clusterIP, using the IP of the load balancer instead.
The port must match the TCP port configured in Telegraf.
Find the correct selector
A Kubernetes cluster can have multiple Prometheus instances scraping different ServiceMonitors. In order to find which ServiceMonitor to scrape, each Prometheus instance has a selector rule that filters out services.
In order to get our monitor scraped by one or more Prometheus instances, we need to add the right information in our ServiceMonitor declaration.
Getting that information is quite easy: just look in the Prometheus CRD description which is the selector that is configured:
kubectl describe -n monitoring prometheus prometheus_instance_name_hereLook in the output for information about Probe Namespace Selector and Probe Selector. In our case, this is:
[...]
  Probe Namespace Selector:
  Probe Selector:
    Match Labels:
      Release:   prom00
[...]
So we know that in order for our ServiceMonitor to be scraped, we need to add a this label: Release: prom00
ServiceMonitor
We can now provide a service monitor that instruct Prometheus to “keep an eye” on our load balancer service:
---
apiVersion: monitoring.coreos.com/v1
kind: ServiceMonitor
metadata:
  name: lbmon
  namespace: monitoring
  labels:
    k8s-app: lbmon
    release: prom00
spec:
  selector:
    matchLabels:
      k8s-app: lbmon
  namespaceSelector:
    matchNames:
    - monitoring
  endpoints:
  - port: metrics
    interval: 60s
The selector we use on the ServiceMonitor spec must match the label we used on our Service and our Endpoint. Note that we also added the label release: prom00 which is needed by our Prometheus selector.
Alerting
Now that the monitoring is in place, we can add an alerting rule to inform us that “…the end is near…” (for the certificate, at least).
Note that we will need to add the release: prom00 label so that the rule get correctly read in our Alertmanager instance.
---
apiVersion: monitoring.coreos.com/v1
kind: PrometheusRule
metadata:
labels:
release: prom00
name: certficate-alert
namespace: monitoring
spec:
groups:
- name: certificates
rules:
- alert: exiration-near
annotations:
message: Certificate for volume expiration is near
summary: Certificate expiration notice for
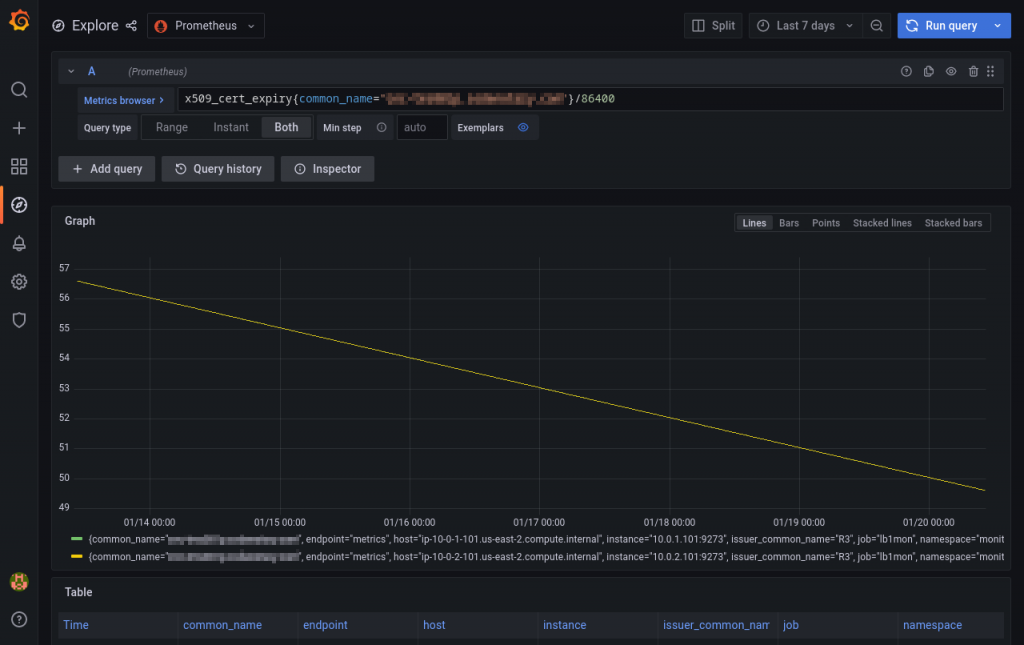
expr: (x509_cert_enddate-time())/86400 <= 15
for: 60m
labels:
severity: warningThe end date and the time are in seconds, so we divide by 86400 (the number of seconds in a day) to get the number of days left. This alert will go off if the certificate expiration is less than 15 days ahead.
And there you have it! Now your certificate expiration is kept under a close eye by our faithful Prometheus.
Conclusions
Monitoring the status and expiration dates of your TSL certificates is vital to providing communications security over computer networks. Using Prometheus and Telegraf in tandem simplifies the supervision of the certificate’s expiration dates even when they are stored outside of your Kubernetes cluster.